On this page
Comprehensive statistics regarding SIMG assessments and outcomes are included in the RACS Activities Reports, published annually for the year ending 31 December. Reports for the past seven years are easily accessible on the Workforce & Activities Reports page.
The below three-year analysis of the outcomes of SIMG assessments in Australia is also provided as a guide, to enable SIMGs to self-assess the likelihood of their surgical training being judged as partially or substantially comparable.
Three-year analysis of the outcomes of SIMG assessments in Australia (JP Comment – we can provide the number over the same 3 year period for Aotearoa NZ. But that should be listed in the Aotearoa NZ section)
RACS reviewed the results of all specialist assessment applications received and processed between 01/11/2018 - 08/11/2021. Of the 129 applications received:
o 24 applicants (19%) were found to be not comparable on paper-based assessment
o 105 applicants (81%) were offered an interview
Interviews proceeded for 105 applicants in total and resulted in:
o 25 applicants (24%) were found to be not comparable at interview
o 61 applicants (58%) were found to be partially comparable at interview
o 19 applicants (18%) were found to be substantially comparable at interview.
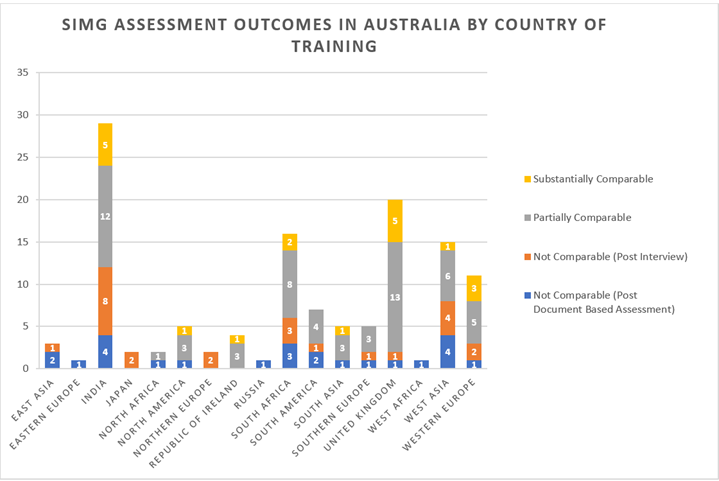
The graphs below shows SIMG Assessment Outcomes by Country of Training. NOTE: the data can only be used as a guide. Each application is assessed on its individual merits.

